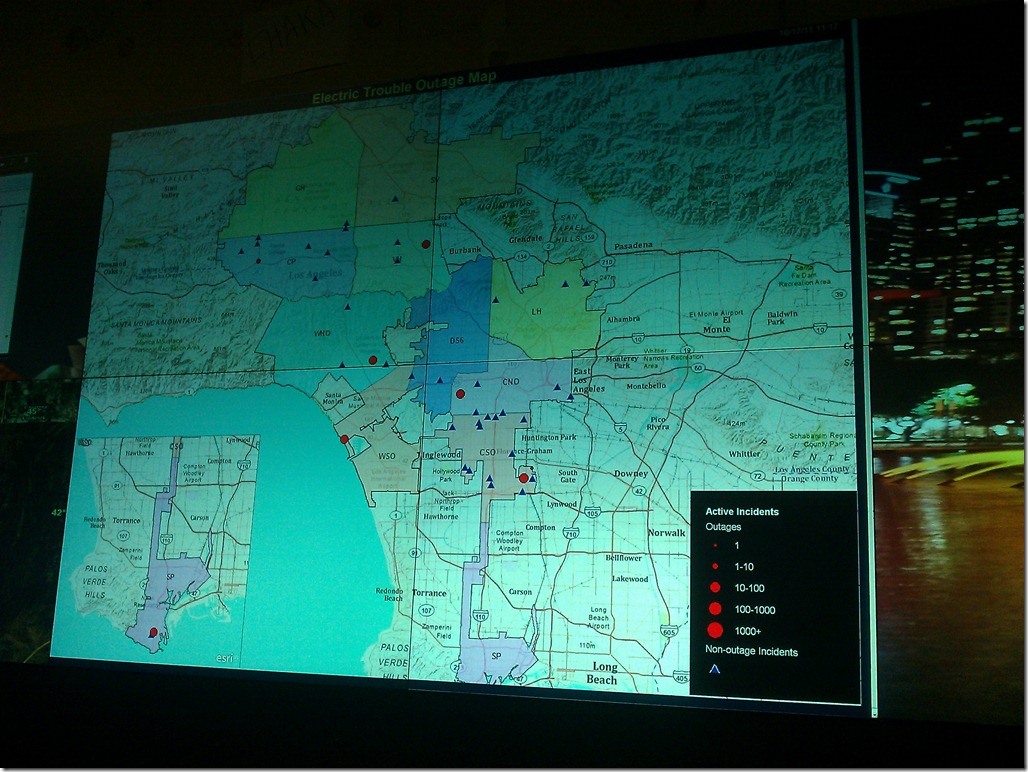
Recently, the major electric utility that I work for installed a wall full of 50”displays in their power outage response control center, and they asked me to start generating content for it. The content would be real-time summary data of the power outages across the utility’s electric distribution network, and the centerpiece was to be a map showing the location of all the current power outages affecting their customers. This was an exciting challenge for me, since I’ve never created applications to be run on large screens with no human interface devices – keyboards, mice, etc. I was particularly excited about figuring out how to implement the map, since I typically develop mapping applications that are meant to be experienced inside of a web browser.
Continue reading “How to Build a 5 Ft Tall Web Map, and Why You’d Want to”
