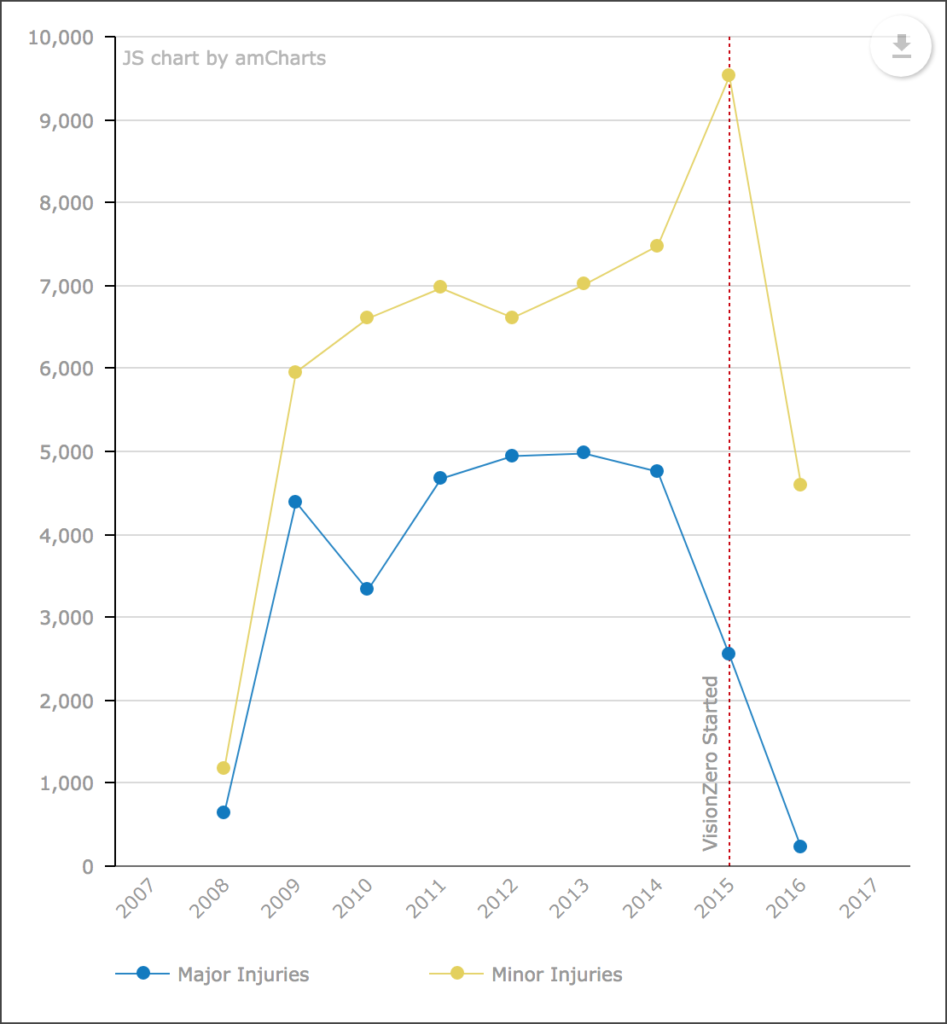
This week we released cedar 1.0.0 in beta and updated the charts in the Hub to use the new version. This lays the ground work for us to make it simpler for ArcGIS Hub users to create and share richer visualizations of their open data.
The focus of cedar v1 is making it easier to create multi-series charts with data from one or more feature layers. Here are a few highlights of what will be changing in v1:
- New chart types including line, area, and radar
- Plot multiple series of data on other chart types besides grouped bar
- Execute multiple queries and combine into a single data source
- A new, Promise-based JavaScript API that is fluent and easier to use
- Now using the AmCharts charting library under the hood
Take a few moments to play around with the new cedar for yourself and let us know what you think.
As always, the investments we make into cedar for the benefit of the Hub also benefit any developers that need to chart data from ArcGIS feature services. You can use cedar in any JavaScript web application, with or without the ArcGIS API for JavaScript. If you’ve got an Ember.js application, ember-cli-cedar provides a {{cedar-chart}} component. That addon is what we use to bring cedar into the Hub, so it’s always up to date with the latest cedar.
This has been a complete rewrite of cedar (using TypeScript) so we’ve still got a few issues to resolve before we have functional parity with v0 and have a release candidate. We’ll be working on those issues over the next few weeks as we deliver a new chart builder experience for Hub pages.
Stay tuned for more updates by watching the repository or following me on twitter; I’m @tomwayson. Don’t hesitate to reach out with any questions.
