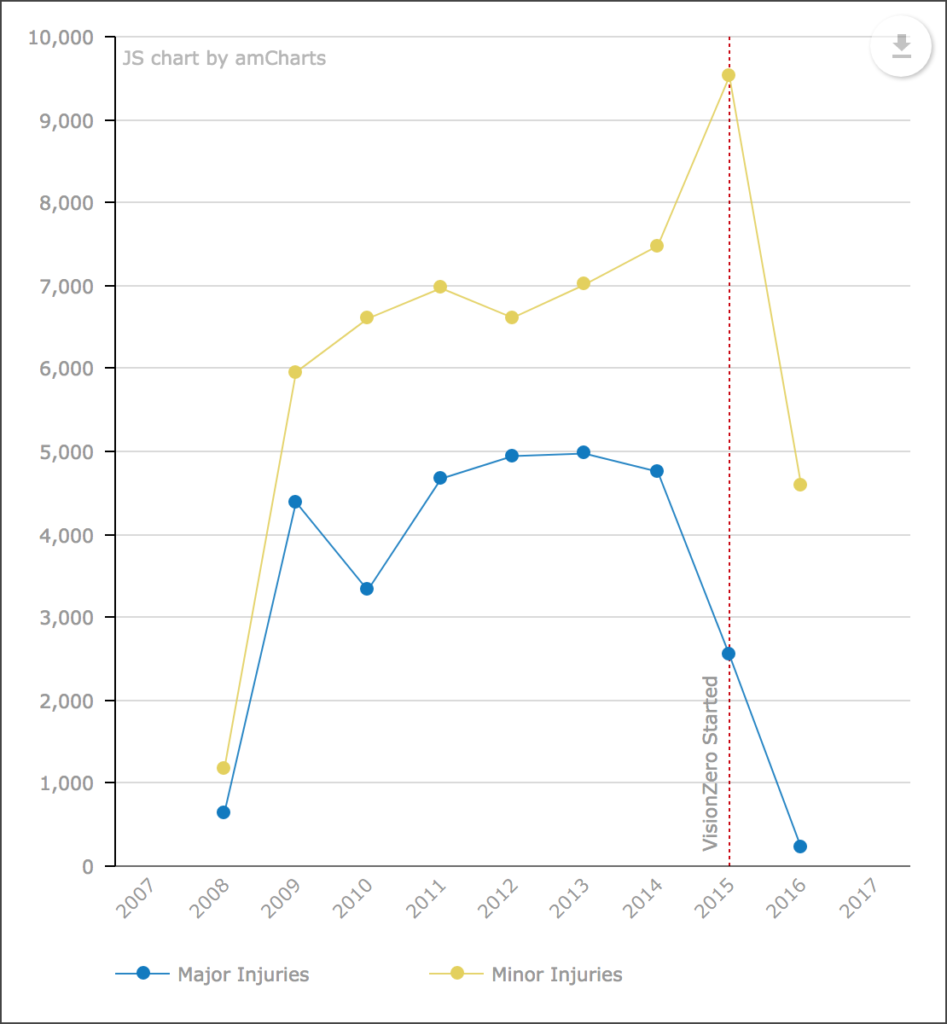
This week we released cedar 1.0.0 in beta and updated the charts in the Hub to use the new version. This lays the ground work for us to make it simpler for ArcGIS Hub users to create and share richer visualizations of their open data.
The focus of cedar v1 is making it easier to create multi-series charts with data from one or more feature layers. Here are a few highlights of what will be changing in v1:
- New chart types including line, area, and radar
- Plot multiple series of data on other chart types besides grouped bar
- Execute multiple queries and combine into a single data source
- A new, Promise-based JavaScript API that is fluent and easier to use
- Now using the AmCharts charting library under the hood
Take a few moments to play around with the new cedar for yourself and let us know what you think.
