Esri Landscape Modeler Application

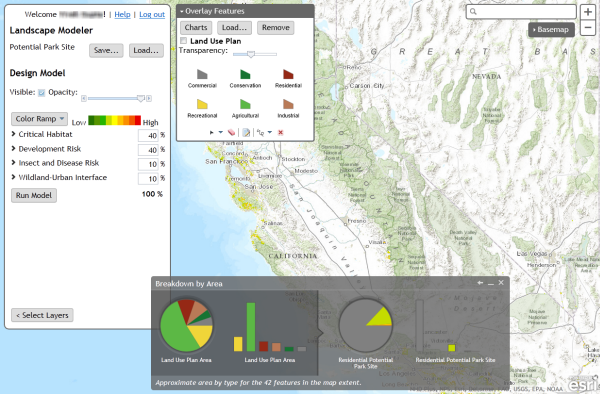
Screenshot of Landscape Modeler

This week the Landscape Modeler application that was previewed at the International User Conference in June has hit the ArcGIS Marketplace.

Landscape Modeler is a web application that allows users to perform fast weighted overlay analysis at multiple scales or over a large area. This is ideal when there are multiple users that want to develop their ideas about suitability analysis models and share their results with each other.

You can find out more about Landscape Modeler listing on ArcGIS Marketplace (don’t worry, it’s free to any user with an ArcGIS Online organizational account). However, I wanted to mention a few things that I find interesting about this application from a developer’s perspective.
Continue reading “Esri Landscape Modeler Application”

Community Maps Contribution Management Application Released

For the better part of my first year at Esri, I have been working on a web application for the Community Maps Program that would make it easier for program contributors to upload and manage their data contributions. We released a minimally viable version of the web application in the fall of 2012 which focused on letting users register for the program and upload data. Since then we have focused on creating an application that lets users manage the complete lifecycle of their contributions from upload, through data review, map cache generation, and finally incorporation into the Esri basemaps. This version came out of beta at the beginning of this month.

The application is for program participants only, but if you are interested in learning more about or contributing to the program you can learn more by visiting the ArcGIS Online features page for Community Maps.

Continue reading “Community Maps Contribution Management Application Released”

How to Build a 5 Ft Tall Web Map, and Why You’d Want to

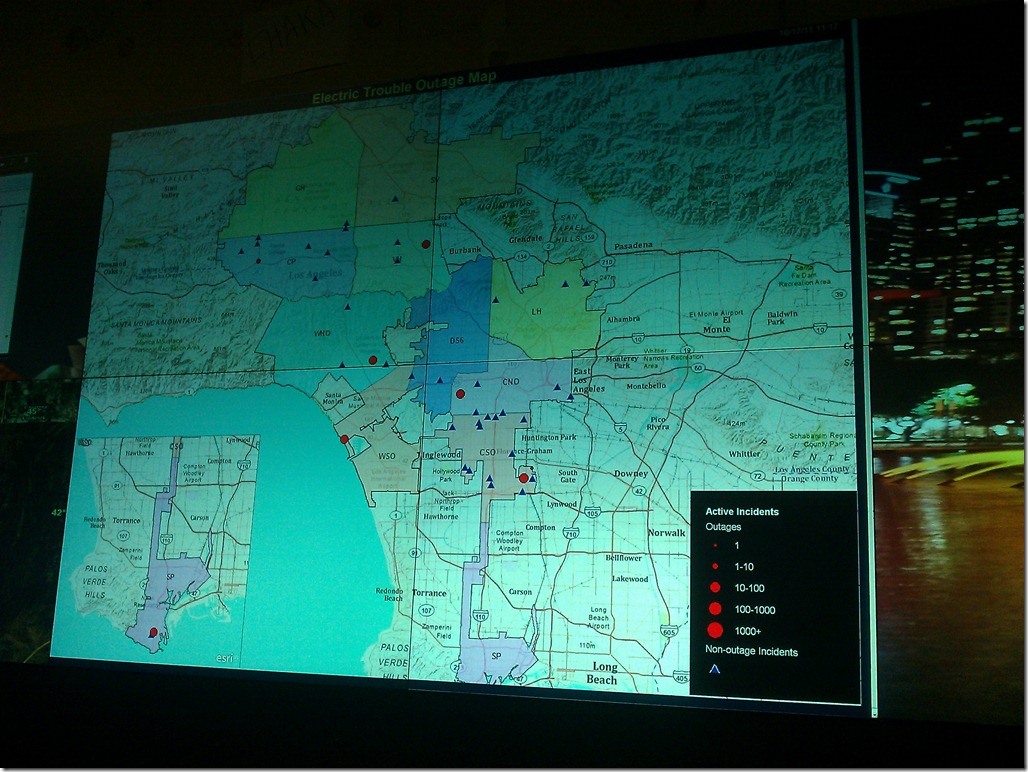
Recently, the major electric utility that I work for installed a wall full of 50”displays in their power outage response control center, and they asked me to start generating content for it. The content would be real-time summary data of the power outages across the utility’s electric distribution network, and the centerpiece was to be a map showing the location of all the current power outages affecting their customers.  This was an exciting challenge for me, since I’ve never created applications to be run on large screens with no human interface devices – keyboards, mice, etc. I was particularly excited about figuring out how to implement the map, since I typically develop mapping applications that are meant to be experienced inside of a web browser.

IMG_20111017_112021

Continue reading “How to Build a 5 Ft Tall Web Map, and Why You’d Want to”

City of Pasadena Interactive Map Enhancements

The enhancements that I’ve been making to the interactive map on The City of Pasadena’s web site went live yesterday!

About the Project

The Google Maps based interactive map was originally developed (by another consulting firm) to help residents identify what neighborhood and city council districts they lived in.  A user entered an address, and the page would display a marker on the map with an info window listing the location’s city and neighborhood council districts.  Below the map the page would show a street view panorama of the location.  The user also had the option of viewing the city council district boundaries on the the map as KML overlays.

The City wanted to enhance the page by also displaying nearby features (such as libraries, transit stations, etc.) on both the map and the list.

Screen shot of The City of Pasadena Interactive Map

Continue reading “City of Pasadena Interactive Map Enhancements”