My GitHub 30 Day Challenge

Last month I challenged myself to try make at least one contribution a day to GitHub for 30 days straight, and as a result I’ve been able to make long overdue updates to all of my existing repositories as well as make meaningful contributions to other peoples’ open source projects. Some of the things I accomplished during the challenge:

The challenge also helped me up my Git Fu a bit, since (sadly) most of my work projects are not managed in Git. If you’re like me, most of your GitHub activity takes place outside of your normal work hours, and this kind of challenge can really help you get to things that have been on the back burner for too long.

My 2013 GitHub contribution calendar
31 days so far… The gaping holes in the above calendar could be labeled “TFS/SVN Time.”

I’d definitely recommend others try a similar challenge. Here are my (self evident) tips for successfully completing your challenge:
Continue reading “My GitHub 30 Day Challenge”

Esri Landscape Modeler Application

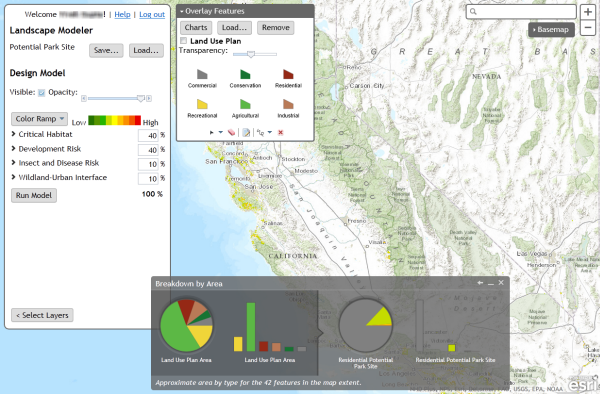
Screenshot of Landscape Modeler

This week the Landscape Modeler application that was previewed at the International User Conference in June has hit the ArcGIS Marketplace.

Landscape Modeler is a web application that allows users to perform fast weighted overlay analysis at multiple scales or over a large area. This is ideal when there are multiple users that want to develop their ideas about suitability analysis models and share their results with each other.

You can find out more about Landscape Modeler listing on ArcGIS Marketplace (don’t worry, it’s free to any user with an ArcGIS Online organizational account). However, I wanted to mention a few things that I find interesting about this application from a developer’s perspective.

Continue reading “Esri Landscape Modeler Application”

Landscape Modeler Application Presented at Esri UC 2013

The Landscape Modeler application that I’ve been working on was presented during the plenary session of the 2013 Esri International User Conference. Lanscape Modeler is a JavaScript application that enables ArcGIS Online users perform weighted overlay analysis with the new landscape datasets that Esri is hosting on ArcGIS Online. The application is able to perform real-time weighted overlay at scales ranging from that of a city to the entire country by leveraging the ability of ArcGIS image services to apply raster functions on the fly.

Below is a video of the quick 2 minute run through that Suzanne Foss presented in San Diego where she demonstrates how to use the application to develop a conservation plan for an area outside of Santa Cruz:

The app will be released in the coming weeks, so stay tuned.

Community Maps Contribution Management Application Released

For the better part of my first year at Esri, I have been working on a web application for the Community Maps Program that would make it easier for program contributors to upload and manage their data contributions. We released a minimally viable version of the web application in the fall of 2012 which focused on letting users register for the program and upload data. Since then we have focused on creating an application that lets users manage the complete lifecycle of their contributions from upload, through data review, map cache generation, and finally incorporation into the Esri basemaps. This version came out of beta at the beginning of this month.

The application is for program participants only, but if you are interested in learning more about or contributing to the program you can learn more by visiting the ArcGIS Online features page for Community Maps.

Continue reading “Community Maps Contribution Management Application Released”

Getting to Know the ArcGIS Online Platform

A few of the sessions at the 2013 Esri Developer Summit got me interested in learning more about how I could utilize some of the new features of ArcGIS Online to help me build web mapping applications. As a developer, my instinct is to approach each new application with a blank page in SublimeText and a cup of coffee, but I’m getting better at learning to utilize the services that are out there to help jump start new development.

Full disclosure: I’ve been working for Esri for close to a year now. I’m sharing my personal experiences in trying to better understand the strengths and weaknesses of the ArcGIS Online platform versus other online mapping platforms. I won’t pretend to be able to be completely impartial, but it is also not part of my job to advocate for the platform.

Now that we’ve got that out of the way we can get down to business. My goals are to understand:

  • How far I can get without writing a single line of code
  • The limits of the built in features of the platform like web maps and templates
  • How to start a project using those built in features (e.g. for rapid prototyping) and then transition to a custom solution to get beyond those limits

The Plan

My plan is to tackle a small application from a few different angles. After seeing the Developing custom JavaScript Applications with ArcGIS Online presentation where they running routes as sample data, I was inspired to build a map of my own trail running routes in Southern California.

Continue reading “Getting to Know the ArcGIS Online Platform”

Creating Mapping Applications with the ArcGIS API for JavaScript and Dojo Bootstrap

When the design team doesn’t do Dijit*

Recently, our design team delivered a functional HTML wireframe that was developed with Twitter Bootstrap. Ordinarily that would not be a problem, but the application we’re working on is based on the ArcGIS API for JavaScript and as such relies entirely on Dojo. The developers wanted to be able to leverage as much of the designers work as we could without having to include jQuery – a dependency of Bootstrap’s JavaScript components. A little digging around lead me to Kevin Andre’s Dojo Bootstrap project – a pure Dojo implementation of Twitter Bootstrap. We were able to successfully use Dojo Bootstrap in our ArcGIS API for JavaScript based mapping application. This enabled us to leverage the declarative mark up and styles already written by the designers without adding a jQuery dependency.

Just in time for the 2013 Esri International Developer Summit, I’ve created a simple application that demonstrates how to incorporate Dojo Bootstrap with the ArcGIS API for JavaScript:

Continue reading “Creating Mapping Applications with the ArcGIS API for JavaScript and Dojo Bootstrap”

How to Build a 5 Ft Tall Web Map, and Why You’d Want to

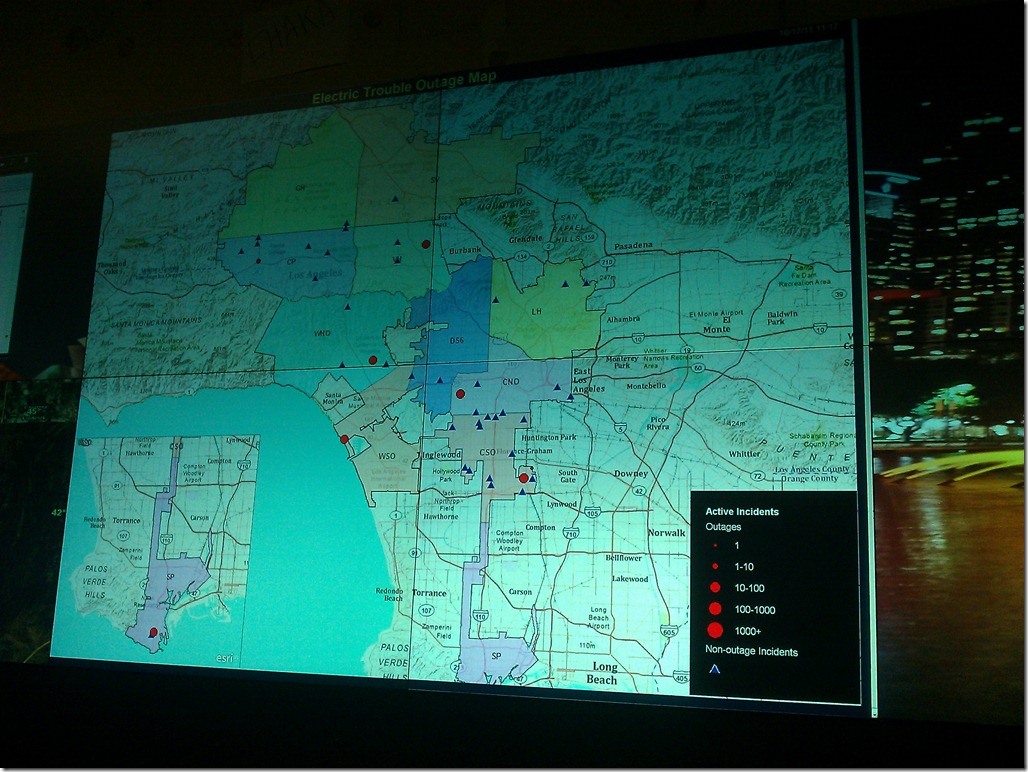
Recently, the major electric utility that I work for installed a wall full of 50”displays in their power outage response control center, and they asked me to start generating content for it. The content would be real-time summary data of the power outages across the utility’s electric distribution network, and the centerpiece was to be a map showing the location of all the current power outages affecting their customers.  This was an exciting challenge for me, since I’ve never created applications to be run on large screens with no human interface devices – keyboards, mice, etc. I was particularly excited about figuring out how to implement the map, since I typically develop mapping applications that are meant to be experienced inside of a web browser.

IMG_20111017_112021

Continue reading “How to Build a 5 Ft Tall Web Map, and Why You’d Want to”

Oracle: Get Month Start and End Dates for a Given Period (i.e. Year)

Took me a few minutes to think this one through, so I thought I’d share. In this example I show the start and end date for each month in the period that contains the fiscal year from 7/1/10 to 6/30/11.

select trunc(add_months('01-JUL-10', level-1), 'MM') start_date,
last_day(add_months('01-JUL-10', level-1)) end_date
from dual connect by level <= ceil(months_between('30-JUN-11', '01-JUL-10'))

START_DATE END_DATE
7/1/2010 7/31/2010
8/1/2010 8/31/2010
9/1/2010 9/30/2010
10/1/2010 10/31/2010
11/1/2010 11/30/2010
12/1/2010 12/31/2010
1/1/2011 1/31/2011
2/1/2011 2/28/2011
3/1/2011 3/31/2011
4/1/2011 4/30/2011
5/1/2011 5/31/2011
6/1/2011 6/30/2011

It should work for periods of any length (i.e. one quarter, 6 months, 2 years, etc) by replacing the period start and end dates.

My First Ride on the Elysian Valley Section of the L.A. River Bike Path

A few happy days a year I have to take my car into the shop. On these days, I strap my bike onto my car rack and take the car into my old dealership in Glendale and get to ride the 9 miles from the shop to work.  Along the way I retrace my old bike commute route from Glassell Park to downtown L.A.  While most of that route is fortunate enough to have actual bike lanes or bike routes, there is one stretch of San Fernando between Glendale Blvd and Fletcher that is outright hostile to bike riders. I recently found out from my friends at Bikeside LA that the Elysian Valley section of the L.A. River bike path opened back in December of 2010, and looking at a map I realized that I could now completely circumvent that nasty bit of road by taking the L.A. River bike path from Glendale Blvd all the way down to the Riveside Drive bridge where I’d pick up my old commute route.  See the map below:

image

Continue reading “My First Ride on the Elysian Valley Section of the L.A. River Bike Path”

Running The ArcGIS JavaScript API in a SquareSpace Site

Just in case you are curious, SquareSpace does allow you to run ArcGIS Server JavaScript API code on their pages.  Here’s a screen shot of a I map made by copying and pasting code from the simple map sample into a SquareSpace page.

image

The only trick was to move the script tags out of the <head> section and into the <body>, since I don’t think that you are able to modify the <head>.  Here’s the complete code listing:

   1:  <div dojotype="dijit.layout.BorderContainer" design="headline" gutters="false" style="width: 100%; height: 100%; margin: 0;">
   2:        <div id="map" dojotype="dijit.layout.ContentPane" region="center" style="border:1px solid #000;padding:0;">
   3:       </div>
   4:      </div>
   5:      <script type="text/javascript">var djConfig = {parseOnLoad: true};</script>
   6:      <script type="text/javascript" src="http://serverapi.arcgisonline.com/jsapi/arcgis/?v=2.2"></script>
   7:      <script type="text/javascript">
   8:        dojo.require("dijit.layout.BorderContainer");
   9:        dojo.require("dijit.layout.ContentPane");
  10:        dojo.require("esri.map");
  11:   
  12:        
  13:        var map;
  14:        
  15:        function init() {
  16:          var initExtent = new esri.geometry.Extent({"xmin":-13632648,"ymin":4542594,"xmax":-13621699,"ymax":4546875,"spatialReference":{"wkid":102100}});
  17:          map = new esri.Map("map",{extent:initExtent});
  18:          //Add the topographic layer to the map.
  19:          var basemap = new esri.layers.ArcGISTiledMapServiceLayer("http://server.arcgisonline.com/ArcGIS/rest/services/World_Topo_Map/MapServer");
  20:          map.addLayer(basemap);
  21:          
  22:          //resize the map when the browser resizes 
  23:          dojo.connect(map, 'onLoad', function(theMap) { 
  24:            dojo.connect(dijit.byId('map'), 'resize', function() {  //resize the map if the div is resized
  25:              clearTimeout(resizeTimer);
  26:              console.log('resize');
  27:              resizeTimer = setTimeout( function() {
  28:                map.resize();
  29:                map.reposition();
  30:              }, 500);
  31:            });
  32:          });
  33:        }
  34:   
  35:        dojo.addOnLoad(init);
  36:      </script>